Machine Learning Sonic Log Predictor
Accessing the API to make predictions
I have built an API using Flask to serve my trained model. The Random Forest Regression & Gradient Boosting Regression models are both very heavy (even with compression=3 in the joblib dump), so in this implementation, the resulting predictions will be an average of the XGBoost, Principal Component Regression, and KNN Regression models only. This lightened model has an RMSE 0.2 points higher than my full submitted model (16.51 versus 16.31).
In order to make predictions, you need a Pandas DataFrame which contains Gamma Ray (GR), Deep Resistivity (HRD), Porosity (CNC), and Density (ZDEN). The column order should be: CNC, GR, HRD, & ZDEN, however; the API function call will re-order them anyway. What is more important is that the columns in the submitted data frame have those column labels.
For simplicity, you can download the full blind test data which was the data used for making final predictions for scoring. Right-click on the "Raw" button and select "Save Link As" to download the file.
1) Import the necessary libraries
        import pandas as pd
        import requests
        import json
2) Prepare the data
        df = pd.read_csv('test.csv')
        df.head()
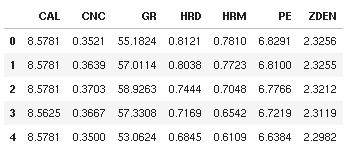
Here, you should see the column names present in the data frame. If these do not match the ones specified above, you can rename them by:
        df.rename(columns={
            'Gamma': 'GR',
            'ResD': 'HRD',
            'Porosity': 'CNC',
            'Rhob': 'ZDEN',
        }, inplace=True)
Replace the keys in the column mapper dictionary with whatever is present in your data, if you are not using the test data.
Drop the labels which are not needed by the model:
df.drop(labels=['CAL', 'HRM', 'PE'], axis=1, inplace=True)
3) Prepare the json request
First, specify the url for the api:
url = 'https://sonicpredict.com/api/get_predictions'
Convert the dataframe data to json format and specify the json headers:
        j_df = json.dumps(df.to_jason(orient='split'))
        headers = {'content-type': 'application/json', 'Accept-Charset': 'UTF-8'}
4) Make the request!
        r = requests.post(url, data=j_df, headers=headers)
        print(f'Request response: {r}')
If all went well, the response back should be: <Response [200]>.
5) Convert the json response string back to a Pandas Dataframe
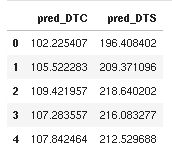
        df_pred = pd.read_json(r.text, orient='split')
        df_pred.head()
6) Merge the predicted curves with the input curves
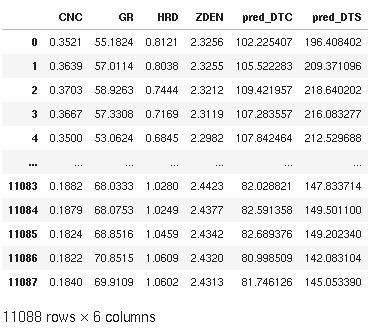
        df_final = pd.merge(df, df_pred, left_index=True, right_index=True)
        df_final
7) Comparing the predictions to the real data
Once the competition was closed, the real blind DTC & DTS data was released. Download by right-clicking on the "Raw" button and selecting "Save Link As".
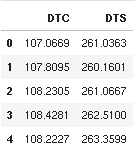
        y_real = pd.read_csv('real_test_result.csv')
        y_real.head()
Use Scikit-learn's mean_squared_error metric to evaluate the predictions RMSE:
        from sklearn.metrics import mean_squared_error
        mean_squared_error(y_real, df_final[['pred_DTC', 'pred_DTS']], squared=False)
16.510940896741243
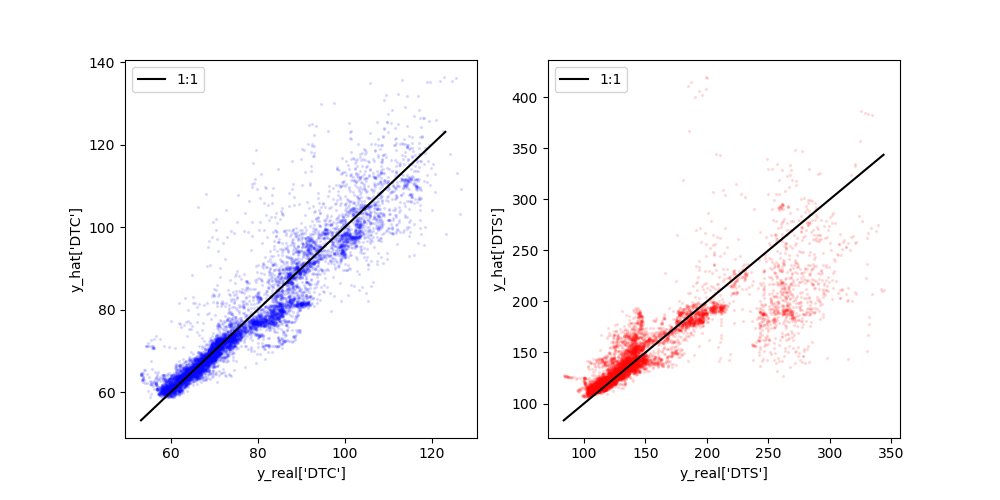
For completeness, here are plots comparing the real and predicted values of both DTC (left) and DTS (right). It is obvious that overall, DTC is predicted relatively reliably. In fact, the RMSE for DTC on it's own is 4.77. However, DTS is much more challenging to predict using this model and as the real values become slower (increasing to the right), the model severely underpredicts DTS. On it's own, the DTS RMSE is 22.86.
Disclaimer: use of SonicPredict's API is meant strictly for educational purposes and should not be used to make investment decisions. Use the predictions at your own peril.